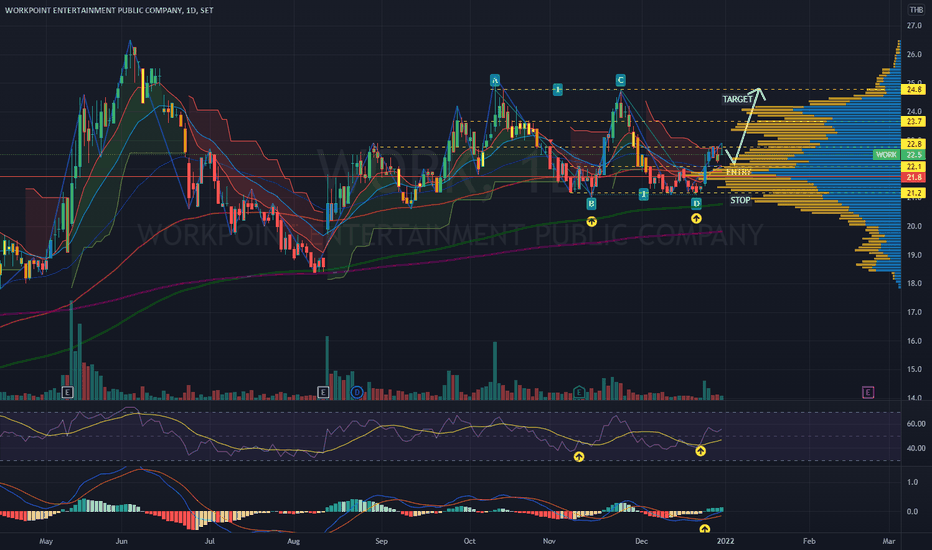
Trend Trading Indicators: How They Work In Trading
Financial markets are complex. Therefore, traders use experience and analytical knowledge to create accurate market forecasts. The vast selection of indicators on trading platforms can be intimidating, but understanding how these indicators can be used in trend trading can greatly increase your ROI. This article will give you a brief overview of trend indicators and how to use them in trading.
What is a Trend Trading?
Trend trading strategy involves capitalising on market trends by identifying and investing in profitable trends. Markets fluctuate continuously, and some prices may move in a specific direction. Trend traders capitalise on these price movements and make the right market calls, whether short or long stocks, to make profits. For example, if a stock price starts increasing and technical analysis suggests it will continue, a buy order can be executed.
Identifying and using a trend is challenging due to the potential for misinterpretation and short-term fluctuations. Proficient trend traders use trend indicators to analyse price movement and its estimated term comprehensively.
Understanding Trend Indicators
Trend indicators are technical signals that offer detailed market analysis and help traders understand the larger picture beyond current price trends. They assist investors in drawing market forecasts, allowing experienced traders to focus on historical price movement, investment cycle phases, and industry activities rather than just the current price activity.
Trend indicators and signals aid traders in understanding potential price direction and market movement, enabling informed decisions to mitigate risk.
However, risks cannot be completely eliminated. Thus, trend traders can face such issues as false signals and whipsaws, leading to losses or premature exits. Traders must be aware of these risks and use additional confirmation tools to reduce their impact. Psychological challenges are also present, as it require discipline and the ability to stick to the trading plan even during periods of drawdown or market fluctuations. Additionally, trend trading may miss out on short-term market movements or range-bound periods, so traders must accept that they will not participate in every market move and may sacrifice short-term opportunities for sustained trends.
The accuracy of trend indicators may vary between industries due to their complexity and market factors. Technical indicators may be effective in stock markets but might not provide accurate analysis in the volatile and dynamic crypto market.
Top 3 Trend Indicators to Increase Your ROI
The trading platform offers numerous trend trading indicators, but we have curated the top three indicators for your trading view to enhance your trading experience.
Moving Average Convergence Divergence Indicator
The MACD indicator is a widely used tool for understanding price dynamics by comparing short-term and longer-term historical changes. It uses the Exponential Moving Average (EMA) component and different timelines like 10-day and 50-day to assess prices in the market. If the short-term historical line crosses above the older-dated price line, it suggests an upward trend.
Bollinger Band Indicator
The Bollinger Band (BB) indicator utilises standard deviation to identify price outlier points and predict potential price dynamics beyond these points.
The indicator shows three lines around the price trend, representing the maximum limit, price, and minimum limit. If the price crosses the maximum limit, it suggests overbuying and will return to normal rates within the Bollinger Bands. If it drops below the minimum limit, it suggests overselling and will return to previous rates.
Relative Strength Index Indicator
The RSI indicator evaluates market fluctuations over the past 14 periods by dividing the previous 14 gains by the last 14 losses. It results in a ratio between 0 and 100, with a ratio over 70 indicating overbuying and a potential drop in the trend, while 30 and below indicate overselling.
Final Words
Trend trading is difficult because market trends can have hidden meanings. Trend indicators help traders study past price data and changes to predict future trends and find investment chances by analysing current and past price changes.


