How To Interpret a Bubble Chart
When businesses use charts to represent data, it serves as a useful technique to visualize collected information. Different charts can be used for business analysis such as identifying strengths and weaknesses as well as serving as a foundation for new strategies and objectives. Businesses can utilize data to learn about competitors and market trends. And they can map out different features of their products and services to see how they're performing in the industry. These graphic representations of data display information in a way that's easy to understand. Independent variables can be mapped out or relationships and correlations can be identified. On this page, you'll learn all about how to interpret a bubble chart, which is also referred to as a bubble plot or bubble graph. Find out what this chart type is used for and what it communicates.

What is a bubble chart?
Bubble charts are used when data needs a third dimension. It's typically considered a relational chart that compares three variables using different colors. Although there are three dimensions of data, the chart utilizes two axes (X and Y). The size of the bubble communicates the third piece of information which is typically not dependent on the first two dimensions of data. The bubble size shows extra information to show other variables and provide more context.
How do you interpret a bubble chart?
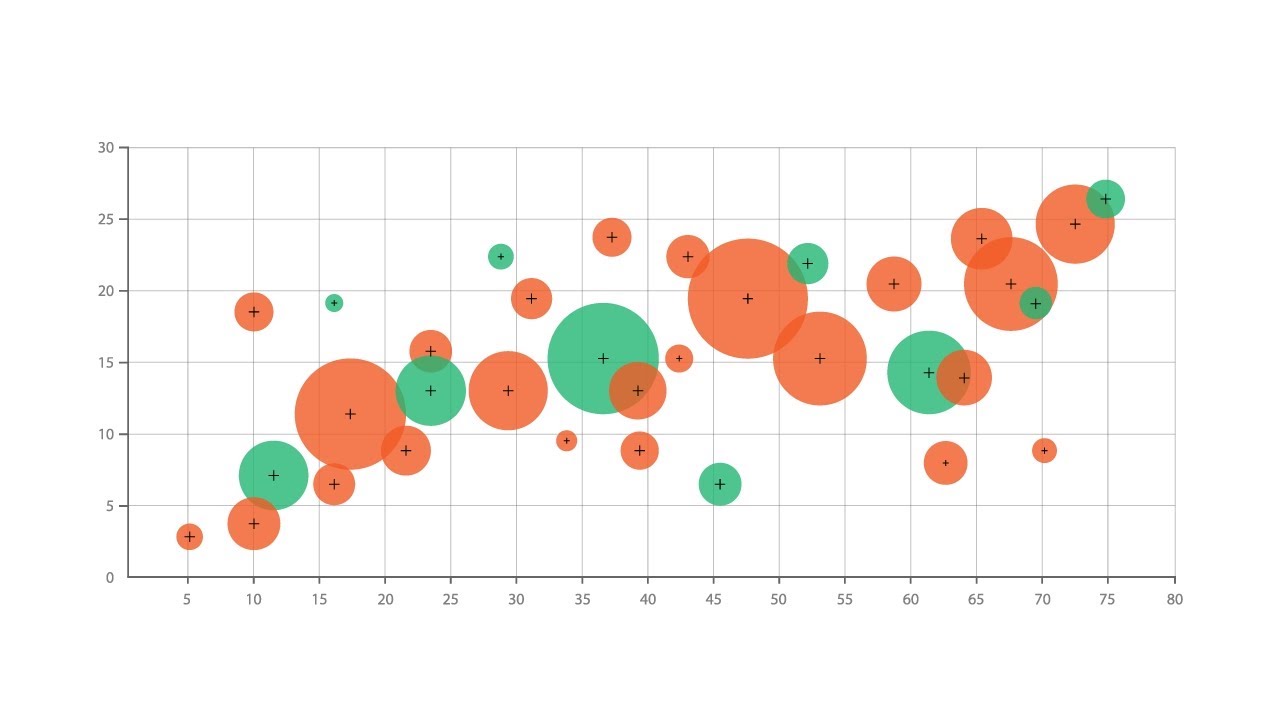
If you want to learn how to read and understand a bubble chart, you'll want to look at it much like any other two-dimensional chart. There are the X and Y axes with variables that are typically chosen for their pre-existing relationship. The size of the bubble represents the gravity of size-based parameters. For example, a bubble chart with a population context will use the bubbles to indicate the size of the population. Different colors mark other variable differences. For example, red bubbles can be for North American retail stores, while blue bubbles can be used for European retail stores in a business context. With a bubble chart, the data can easily identify outliers, gaps, and clusters.
When should you use a bubble chart?
It's best used for binary questions like whether variables share a relationship. In a business context, a bubble chart can be used for financial processes like valuation and investments. The bubble size can represent the risk associated with a specific investment. It can also work in a retail setting where the graph showcases electronic sales versus furniture sales. A bubble chart can even be used for socio-economic examples. The population size of a country will start small but begin to increase over time when more infrastructure is built. But it could also decrease due to population control measures. The size of the bubbles and the axis showing time can illustrate these examples.
Are there any common issues to look out for in a bubble chart?
When there's too much data present, a bubble chart can get confusing pretty quickly. This is especially true when the bubbles overlap or cluster together. It can cause viewers to interpret the wrong conclusions. So, it's important to keep the number of data points to a minimum. These charts also aren't great for representing negative values. This is simply due to the fact that circles cannot represent a negative area. Thankfully, there are some alternatives to a bubble chart.

What are some alternatives?
You can utilize a scatter plot for something with a similar appearance but that only has two variables plotted. Categorical column charts are also a good option. And cherry charts are similar to scatter plots with stalks to indicate volume.
Now that you know how to interpret a bubble chart, there are a number of ways to use them in a variety of industries.